VisCHAINER: Visualizing genome comparison
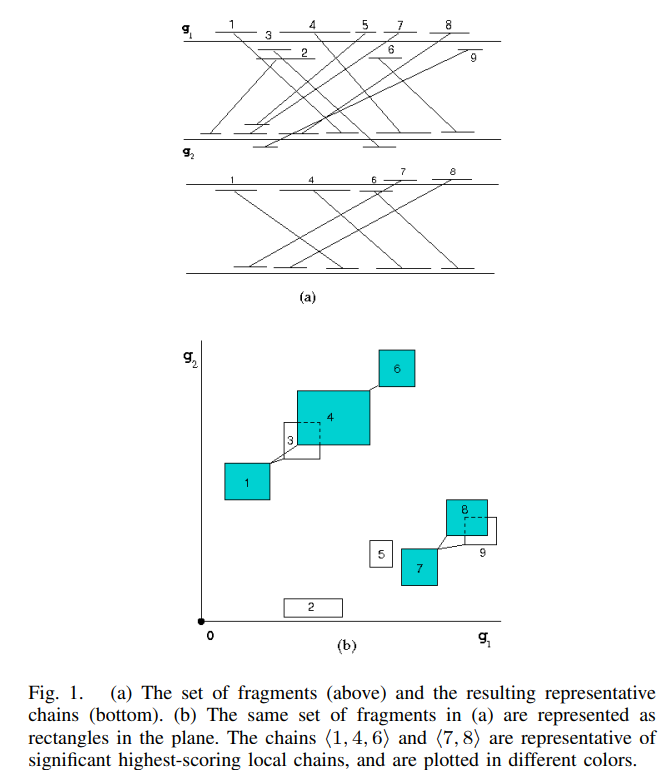
Visualization of genome comparison data is valuable for identifying genomic structural variations and determining evolutionary events. Although there are many software tools with varying degrees of sophistication for displaying such comparisons, there is no tool for displaying dot plots of multiple genome comparisons. The dot plot mode of visualization is more appropriate and convenient than the traditional linear mode, particularly for detecting large scale genome deletions, duplications, and rearrangements. In this paper, we present VisCHAINER, which addresses this limitation, and displays dot plots of multiple genome comparisons in addition to the traditional linear mode. VisCHAINER is a stand-alone interactive visualization that effectively handles large amounts of genome comparison data. © 2008 IEEE.


